Wednesday 11 December 2013

NATURAL GAS OUTLOOK (11-DEC-2013)

Fundamentals of Natural Gas NYMEX:
With the traditional pre-winter rally in natural gas underway, bullish predictions of much higher prices are starting to emerge. But is the natural gas market - which has been burdened with oversupply for quite some time - finally ready to break out?

The latest supply and demand data from the Energy Information Administration may offer some clues. On the supply side, little has changed. Output continues to boom and there are no signs of an imminent decline in production, as many analysts have predicted time and time again.
In July, gross natural gas production in the U.S. jumped to 74.52 bcf/d, a record high. That was up 1.8 bcf/d, or 2.5 percent, from a year ago.

Technicals of Natural Gas NYMEX:
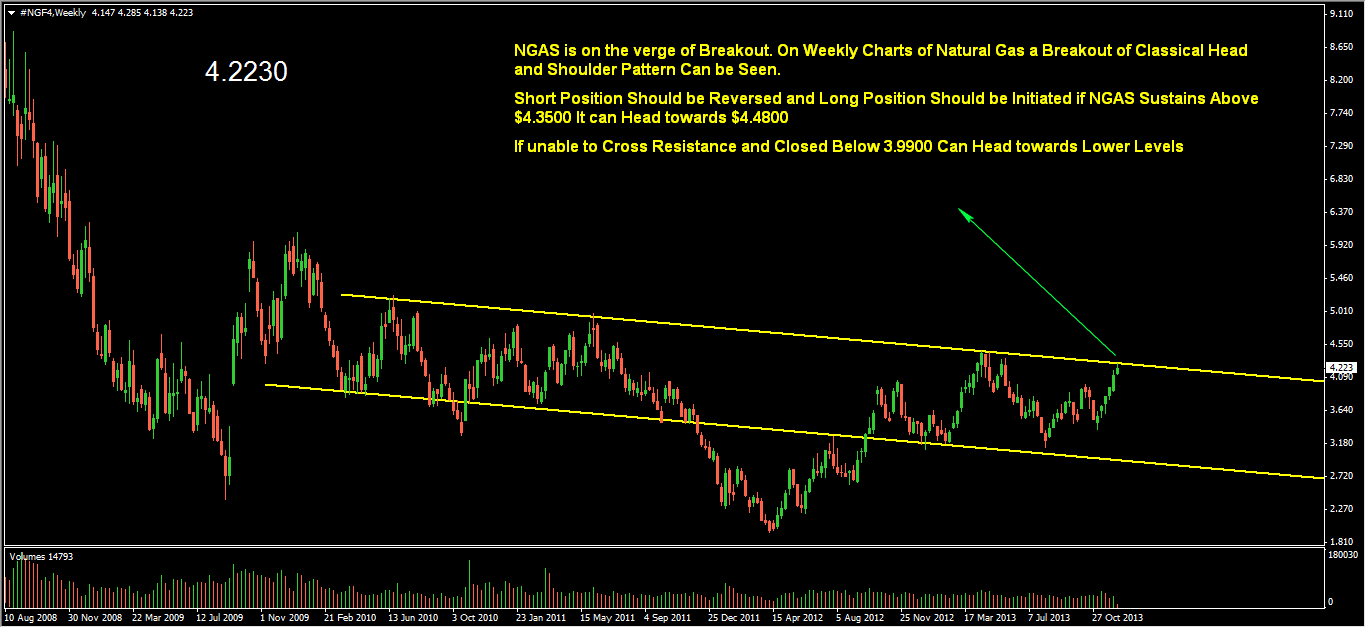
NATURAL GAS is on the verge of Breakout. On Weekly Charts of Natural Gas a Breakout level of Classical Head and Shoulder Pattern Can be Seen. Short Position Should be Reversed and Long Position Should be Initiated "if" NGAS Sustains Above $4.3500 It can Head towards $4.4800

Unable to Cross Immediate Resistance @4.3200 and Closed Below 3.9900 Can Head towards Lower Levels as Fundamentals Also Suggests.


Thursday 14 November 2013

MCX CRUDEOIL Strategy For Investors And Swing Players....!!!!

MCX CRUDEOIL Strategy For Investors And Swing Players

MCX CRUDEOIL is Trading Near to Support Levels @5850-5950. And A Fresh Long position Can be Initiated by Commodity Investors and Swing players. Immediate Resistance on Charts is @6175 and Hence Buy Crudeoil @5950 and 5850 with Stoploss of 5780 For Targets of 6175 and More.


1. WTI- CRUDEOIL is Consolidating Between Classical Channel Pattern And Trading Near to the Support of Channel @92-94 $.

2. We Recommend investors and Swing Player to buy Crudeoil.  As at Support Levels Risk and Reward Ratio is Favourable.

3.  If it Breaks Channel Support and Trades below 91$ Reverse your Long Positions and initiate Fresh Position. 


Sunday 10 November 2013

GOLD WEEKLY TRADING STRATEGY


GOLD MCX FOUR HOURLY CHART 11-Nov-2013


GOLD COMEX FOUR HOURLY CHART 11-NOV-2013
WEEKLY TRADING STRATEGY: 

GOLD MCX faced correction last week and due to US strong Employment Data Precious Metals in COMEX face a sell off and GOLD COMEX broke important Support @1300-1295$ and Close below it.  Hence this week we may see down trend continuing.  GOLD MCX is also trading near to strong Support Levels @29550 and If Sustains below it can head towards lower levels @29000. Alternatively if sustains above its Demand Zone i.e. 29400-29500-29600 it can bounce back towards 30400 and Hence We Recommend to Go Short Below 29500-29400 and Go long only if GOLD sustains Above 30400.  

Sunday 3 November 2013

Profit Play Wishes "HAPPY DIWALI"


Nifty Previous Week Performance (3-Oct-2013)

Recommended buy Nifty Spot On 28-Oct-2013 Monday On Dips and Above 6220. Nifty Made a High Of 6332.60 Target 2 Achieved. @6300 Hope you Booked Superb Profits.

Trading Strategy For The Week Was as Follows
1. Buy NIFTY @6080-6090 TGTS 6250/6300. 
2. Buy NIFTY Above 6220 TGTS 6250/6300


We Provide True Research and There is Nothing Like Premium call, Don't Miss Call
All Our Research and Calls are Trades on which we personally have taken Positions.

Sunday 27 October 2013

GOLD AND SILVER COMEX Weekly Analysis (28-Oct-2013)

GOLD COMEX WEEKLY:
We Recommend to long GOLD COMEX above 1360$ for target of 1400$ with Stoploss of 1340$ Alternatively Go Short below 1325$ for Targets of 1300$ with Stoploss of 1345$
Trading Strategy: 
GOLD COMEX has stiff resistance @1355-1360$ levels. Markets Looks to be in Favor of Bulls and it Seems that Gold will breach its Immediate resistance Levels. Next Minor Resistance Level  that GOLD COMEX faces is @1370 and a Next Major Resistance is @1400$ which would also act as an psychological Level for GOLD. Alternatively if Unable to cross Resistance of 1355$ you may see Sell off below 1330$-1325$ and it can Head towards 1300$ mark.
------------------------------------------------------------------------------------------------------------
SILVER COMEX WEEKLY
We Recommend to initiate Long Position above 22.90$ for Target of 23.65$ and also buy at any Correction @22.10$. Stoploss should be maintained below 21.70$.
Trading Strategy: 
SILVER COMEX has formed classical double bottom pattern in a down trend and trading near to immediate Resistance Levels @22.85$ if SILVER COMEX crosses the levels of 22.85$ it may head towards higher levels @23.65$ Alternatively fresh long Position can also be initiated at lower levels around 22.10$.


STOCK FOR WEEK

5 Stock Recommendation For Week.

1. BUY AXIS BANK ON DIPS @1170 SL 1120 TGT 1220

2. BUY BAJAJ AUTO ON DIPS @2060 SL BELOW 2030 TGT 2100

3. SEL HCL TECH BELOW 1135 SL 1145 TGT 1020

4. BUY LIC HOUSING ABOVE 215 SL 210 TGT 225

 5. BUY SESA GOA ABOVE 196 SL 188 TGT 206

NIFTY SPOT (28-OCT-2013)

NIFTY SPOT (28-OCT-2013)

Nifty Index is Trading near to its all time Highs. Bulls are in and Hence Buying at any Major Supports Will be Recommended. Immediate Strong Support @ 6080-6090. Immediate Resistance @6210-6220

Trading Strategy For The Week
1. Buy NIFTY @6080-6090 TGTS 6250/6300
2. Buy NIFTY Above 6220 TGTS 6250/6300


Sunday 22 September 2013

SILVER MCX & COMEX WEEKLY OUTLOOK

SILVER MCX & COMEX WEEKLY OUTLOOK (23-SEPT-2013)


SILVER COMEX:
Immediate Resistance @23.15$
Immediate Support @22.35$

Silver COMEX if Sustains above 23.35$ may head towards Higher Levels. For the next week Strategy should be to buy SILVER COMEX around 22.35$. Alternatively If Breaks 22.30 then may Initiate Short Position. Next Support Lies around 20.25$.

We Recommend to Sell SILVER COMEX Below 22.25$ SL 22.80$ TGT 20.25$

 SILVER MCX:
Immediate Support @48450
Immediate Resistance @51200

SILVER MCX if breaks the level of 48400 next  week one may initiate short Position. For pull Back Strategy one can Take Risk to long around 48500 with Small Stop Loss. Above 51200-51500 Silver May enter Bullish zone and Fresh Long Position Can be Initiated.

We Recommend to Sell SILVER MCX below 48300 SL 48800 TGT 47100

GOLD COMEX & MCX (23-SEPT-2013)

GOLD OUTLOOK FOR NEXT WEEK (23-SEPT-2013)


GOLD COMEX:
Immediate Resistance @1347-1350$
Immediate Support @1300$

For the next Week (23-Sept-2013) Trading Strategy Would be to Sell on rise around 1347$ and also Below 1295$. Trend is in favour of bears. alternatively if sustains above 1350$ we may see Gold heading towards 1410$.


GOLD MCX:
Immediate Resistance @30400$
Immediate Support @29800$

For the next Week (23-Sept-2013) Trading Strategy Would be to Sell Below 29800 with SL 30400 TARGETS 29200. Trend is in favour of bears. Alternatively if sustains above 30500 we may see up trend resuming.

USDINR looks weak on fundamental reasons and RBI policy impact can bee seen this week. Market may trade too volatile and hence do not trade without stoploss

Tuesday 2 April 2013

SILVER COMEX and SILVER MCX Trading Near to SUPPORT


SILVER MCX (2-April-2013) on daily charts seems to be trading near to Strong support zone 51300-51100, As SILVER today has a faced major Correction, Some Relief Rally is likely and Risk and Reward Ration on initiating a Long Position at current Levels will be favorable.

From Current Levels (51350) we recommend to Initiate a long position on SILVER MCX with stoploss as 50800 on Closing Basis.


SILVER COMEX is Also Trading Near to channel support around 27.20 - 27.25$ and there can be some relief rally in coming days for short term. Immediate Resistance is around 28.20$ and Risk Reward Ratio on while initiating a Long position is always high near to supports.

From Current Levels 27.22$ we Recommend to initiate a Fresh long position.
If Breaks 27$ on closing Basis then SILVER COMEX may head towards lower support levels around 26- 25.90 $

Wednesday 27 March 2013

COPPER & LEAD COMEX FRESH BREAK DOWN

COPPER COMEX BREAKDOWN WEEKLY CHARTS


COPPER COMEX (27-March-2013) recently on weekly charts gave a breakdown of a classical symmetrical Triangle Pattern and Next Support is @3.20 $ Selling Opportunity Lies at current Levels. Major Profit Booking has been Seen in Commodities including Precious Metals and Base Metals.

Now Trading Near to levels around 3.4200 $. Here the Breakout on the weekly charts we suggest one can Initiate a Short Position on Copper MCX also following the Levels at COPPER COMEX. 


LEAD COMEX BREAKDOWN ON DAILY CHARTS


Fresh Breakout on The Charts of LEAD COMEX. Broke a Strong Trend line support Levels on Daily Charts. Next Support @1920 $ One Can Initiate a Short Position and Any bounce back towards higher level will be a selling opportunity.

Now Trading Near to Levels around 2115$ and further correction can can take LEAD COMEX around next Support @1920$. Based on the Breakdown on Daily charts Trend line support we suggest to Initiate Short Position at current levels and any any bounce back at higher levels will be a opportunity to take a short position. 

Thursday 21 March 2013

SILVER MCX AND COMEX

HOURLY CHARTS OF SILVER MCX AND SILVER COMEX


SILVER MCX may face stiff resistance around 55300- 55400 levels. One can Initiate a short position around these levels.


SILVER COMEX may Face stiff Resistance around 29.50$- 29.45$ Levels. One can Initiate a short position around these levels.


Wednesday 20 March 2013

GOLD MCX

GOLD MCX May face Stiff Resistance Around 29950- 29970. Sell Around 29950 with SL 30050
If GOLD MCX Closes Above 29970 it May head Towards 30400.


Thursday 14 March 2013

Silver COMEX

Hourly Chart Of Silver at COMEX


Silver COMEX can bounce Back from Current Levels Keep SL @28.50$ and Stay Long.

Reverse Position if Breaks 28.50$ levels and Sustain below these levels. Initiate Short Position if Silver Comex Trades Below 28.50$ Levels.

Monday 11 March 2013

Gold COMEX

11- March-2013

Trading in a Range

Gold Comex is Trading In a Range between 1585$ - 1565$

Buy GOLD COMEX Around 1565$ with SL 1558$ TGT 1585$
Sell GOLD COMEX Around 1585$ with SL 1592$ TGT 1565$

Sunday 4 November 2012

Short Term Call


Buy 3i Infotech above 8.5 with S/L 6.5 TGT 13-15

3i Infotech is being Accumulated at every Draw Down and Trading near All time Lows because of its Fundamentals but Technical Study Suggest There can be a big Price moment on Upside in Coming Days.

Watch Out Volume and Price Movements marked with Arrows on The Charts It can be Clearly understood.

Friday 2 November 2012

Short Term Call


Buy And Hold APOLLO TYRES Above 89.9 TGT 110 S/L 84

As Today On 2-Nov-2012 Company Will Post its Second Quater Results
And are Exptected to be Robust so Technically and Fundamently
APOLLOTYRES is a Good Pick.

Note: IF Today Open with GAP UP At Higher Levels Try to Accumulate
Stock at each drawdown. Or Other wise buy as Suggested above.


Short Term Call

Buy LIC HOUSING FINANCE Above 250.5
TGT-1 : 265
TGT-2 : 270
Stoploss : 239

LICHSGFIN is Trading near Support Trend Line and Can Bounce back From These Levels.
Should be Bought With Time Frame of 15days. Nifty is Correcting From higher Levels and LICHSGFIN Can Also Break Support Levels So Trade With Tight Stoploss.

Thursday 1 November 2012