Showing posts with label COMEX & NYMEX. Show all posts

Wednesday, 18 March 2020

Crude Oil NYMEX ?? Is it Right time to buy Crude, Below is the Answer:

Sharp sell off has been across the globe and one of the beaten down consumable commodity is CRUDEOIL, As per the technical study and pattern, structure of NYMEX Crude is trading descending triangle. Currently trading near 25$ Per barrel and it can bottom out between 24$ to 22$.

Buying CRUDEOIL on MCX exchange when NYMEX trades between 24- 22$ provides comfort as far as risk and reward rations are concerned. 

Recommendation: One can go Long on Crude oil when NYMEX Prices trades between 22-24$ With Stoplosss 19.50$ and Targets of 35-40$ in the next few months.

#crudeoil #crude #commodity #trading #oil #mcx


Wednesday, 7 August 2019

GOLD COMEX VIEW AUGUST 2019

GOLD COMEX seems to be heading towards 1600$ per ounce in the near term, Now Equity as an asset class seems to be under performing and Gold after a huge consolidation is best asset class to invest in.  


Monday, 15 February 2016

GOLD INTRADAY AND SHORT TERM VIEW (15-Feb-2016)

GOLD INTRADAY BUY OPPORTUNITY (15-FEB-2016)

Below is the Chart of GOLD COMEX, Strong Trend Line Support Lies at 1214$, Today Indian Markets has Opened with Gap Down, And Hence Likely to cover the Gap, Hence we Recommend to Buy GOLD With an Stoploss of 1214$ for the Intraday.


Saturday, 22 February 2014

Is GOLD COMEX Poised for Upside.....??

SHORT TERM TECHNICAL OUTLOOK:

GOLD COMEX made a double bottom pattern  on weekly Charts, found a Strong Support @1180$ and has retraced towards higher levels @1325$, Fibonacci levels of 23.6% comes out to be 1350$. After a Hefty correction from 1920$ to 1180$ which comes out to be approx. 740$ correction per ounce in last 2.5 years, Now we may see some bounce towards higher levels. Currently Trading @1310- 1315$ which is a strong weekly support zone. In August 2010 from these levels @1310 GOLD saw a strong rally towards 1920$.

Hence we Recommend buy GOLD COMEX till 1310$ (CMP: 1324) with SL of 1285$ and targets of 1350$.

More Upside Can be Seen Till 1350$

PREVIOUS WEEK DATA IMPACT ON US ECONOMY:

SLOW DOWN IN HOUSING SECTOR:
The extreme cold of January took a heavy toll on the housing sector including housing starts which plunged 16.0 percent, Which is Negative Signal for the US Economy and hence we may see Buying resuming in Precious Metals
JOBLESS CLAIMS SLIGHTLY LOWER:
Jobless claims are steady and point to intend readings for the February employment report. Initial claims for the February 15 week, which is also the sample week for the monthly employment report, edged 3,000 lower to 336,000. Which does not proves any Major improvement in US economy.


Friday, 21 February 2014

CRUDEOIL NYMEX and CRUDEOIL MCX Short Term View..!!

Technical Outlook: 

Trading in a Classical Channel Pattern, On Daily Charts There is Stiff Resistance around 103.50$. Since its a Channel top and There is Resistance on Daily Charts, (i.e. Horizontal Resistance on daily chart and Channel Patter Resistance both Coincide)  it would be feasible to take a Short Position in CRUDE OIL. Relative Strength Index looks overbought on 4 hourly charts and momentum Indicator is also Overbought. Its a confirmation for Selling. Hence We Recommend to Sell WTI CRUDE OIL till 103.50 (CMP: 102.80) keep an stop loss of 104.50 and Targets of 100 $. Risk and Reward Ratio is also favorable in taking short position.

For MCX CRUDE OIL According to International Markets We suggest Sell As after a bull run after a breakout above 6280 has seen no correction in the Rally. Hence We suggest short CRUDE OIL MCX with Stoploss of 6470 for Targets of 6320, Current Market Price 6413 (Closing of 20-Feb-2014)

If trades and Sustains above 104.50 $ Fresh buying may Resume, And Hence Stop loss of 104.50$ would be strongly recommended.


Economic Outlook:

Petroleum inventory data are little changed in the February 14 week with oil inventories up 1.0 million barrels to 362.3 million. Which Suggests Week Demand of Crude oil and Hence we may see some Correction in Prices of Crude oil.


Wednesday, 12 February 2014

SILVER Bottomed Out....?? Its Time to Buy...??

Technical View:
(FOR INVESTORS and LONG TERM TRADERS)

Comments and Strategy:

SILVER COMEX after a hefty correction from 49$, Now SILVER is trading Near to 18$ - 20$. There seems to be Strong Accumulation in Silver before a fresh Rally towards Higher Levels from here.

Before a Rally it might be Possible that we see a trap breakdown. Silver COMEX bottom seem to be there.
Even Physical buyers and Investors can bet on SILVER and buy 50% quantity. Any major Correction will be just buying opportunity, buy Rest 50% quantity on a major dip around 16$ levels

Since November 2013 SILVER is trading in a Range of 2$ and Any Breakout after Such an long consolidation is always Bigger and better.

USD-INR can Correct from these Levels @62- 63 and Rupee can Head towards 55/ dollar  in this year. Hence Keep a close watch on currency movement, Stronger Rupee may stop SILVER MCX to head towards Higher levels.


Calls Success by Profit Play

Here We are:
Calls with Good Risk and Reward Ratios, Which can mint Money, Our Main Focus is on Profits not just Accuracy. Just Have a look on our Past Predictions:

1. NATURAL GAS NYMEX (11-DEC-2014) Click here to see NG call

2. CRUDEOIL NYMEX (18-JAN-2014) Click here to See Crudeoil Call

3. GOLD COMEX (18-JAN-2014) Click here to See GOLD Comex Call


Saturday, 18 January 2014

CRUDEOIL NYMEX weekly Outlook (20-Jan-2014)

CRUDEOIL NYMEX
View:
Trading Near to very Crucial Levels @91$, Strong weekly Support lies @91$ and a Sharp bonce back has been seen in Crude-oil from those levels. We have a Positive outlook on Crude-oil till it sustains above 91$. Short Position Can be initiate only below 90$ Hence we Recommend to Go long on CRUDE-OIL on Current levels and buy till 91.50$ with Stop-loss below 90.50$ As Risk and Reward ratio on Going long is high. Reverse Long Position if break 90$ and Closes below it on 4 hourly charts.

Profit Play's Take on CRUDE-OIL:
1.       Buy CRUDE-OIL till 92$ For Targets 100$ with Stop-loss of 90.50$
2.       Sell CRUDE-OIL below 90$ for Targets of 86$ and Stop-loss of 93$

SILVER COMEX Weekly Outlook...!! (20-Jan-2014)

SILVER COMEX:
View:
Looks Strong on Weekly Charts, took support @19.00$ previously in July August 2010 Silver has a strong bull run form there levels @19.00$ hence its an very crucial levels. We have a positive outlook on SILVER and we suggest to go long on SILVER COMEX if sustains above immediate levels @20.70$, alternatively one may Go short if Breaks 19$ on Closing basis. A Sharp Correction may be seen if we see a weekly Close below 19$.

Profit Play's Take on SILVER:
1.       Buy SILVER ABOVE 20.70$ For Targets 22.50$ and Stoploss of 20.00$
2.       Sell SILVER only Below 18.80$ For Targets of 17$ and Stoploss of 19.50$

GOLD Weekly View...!!! 2014

GOLD COMEX:
VIEW:
In International Markets GOLD took a strong Support @1175- 1180$ and is now trading near to stiff Resistance @1265-1270$. New Bull Phase can be seen in Gold, if weekly close above 1270$. And if unable to sustain @1265- 1270$ Resistance then we may see GOLD again heading towards 1180$,

"Daily Closing Below 1180$" We may see Sharp Correction and Gold may continue its bearish Trend. GOLD is Trading near to very Important and Crucial levels and one may initiate Long GOLD if sustains above 1270$ and If Strong Reversal seen from Those levels then initiate Short Position below 1230$

Profit Play's Take on GOLD:
1.       Buy GOLD ABOVE 1280$ For Targets 1325$ and Stoploss  of 1250$
2.       Sell GOLD BEOW 1230$ For Targets 1180$ and Stoploss of 1245$

Wednesday, 11 December 2013

NATURAL GAS OUTLOOK (11-DEC-2013)

Fundamentals of Natural Gas NYMEX:
With the traditional pre-winter rally in natural gas underway, bullish predictions of much higher prices are starting to emerge. But is the natural gas market - which has been burdened with oversupply for quite some time - finally ready to break out?

The latest supply and demand data from the Energy Information Administration may offer some clues. On the supply side, little has changed. Output continues to boom and there are no signs of an imminent decline in production, as many analysts have predicted time and time again.
In July, gross natural gas production in the U.S. jumped to 74.52 bcf/d, a record high. That was up 1.8 bcf/d, or 2.5 percent, from a year ago.

Technicals of Natural Gas NYMEX:
NATURAL GAS is on the verge of Breakout. On Weekly Charts of Natural Gas a Breakout level of Classical Head and Shoulder Pattern Can be Seen. Short Position Should be Reversed and Long Position Should be Initiated "if" NGAS Sustains Above $4.3500 It can Head towards $4.4800

Unable to Cross Immediate Resistance @4.3200 and Closed Below 3.9900 Can Head towards Lower Levels as Fundamentals Also Suggests.


Thursday, 14 November 2013

MCX CRUDEOIL Strategy For Investors And Swing Players....!!!!

MCX CRUDEOIL Strategy For Investors And Swing Players

MCX CRUDEOIL is Trading Near to Support Levels @5850-5950. And A Fresh Long position Can be Initiated by Commodity Investors and Swing players. Immediate Resistance on Charts is @6175 and Hence Buy Crudeoil @5950 and 5850 with Stoploss of 5780 For Targets of 6175 and More.


1. WTI- CRUDEOIL is Consolidating Between Classical Channel Pattern And Trading Near to the Support of Channel @92-94 $.

2. We Recommend investors and Swing Player to buy Crudeoil.  As at Support Levels Risk and Reward Ratio is Favourable.

3.  If it Breaks Channel Support and Trades below 91$ Reverse your Long Positions and initiate Fresh Position. 


Sunday, 10 November 2013

GOLD WEEKLY TRADING STRATEGY


GOLD MCX FOUR HOURLY CHART 11-Nov-2013


GOLD COMEX FOUR HOURLY CHART 11-NOV-2013
WEEKLY TRADING STRATEGY: 

GOLD MCX faced correction last week and due to US strong Employment Data Precious Metals in COMEX face a sell off and GOLD COMEX broke important Support @1300-1295$ and Close below it.  Hence this week we may see down trend continuing.  GOLD MCX is also trading near to strong Support Levels @29550 and If Sustains below it can head towards lower levels @29000. Alternatively if sustains above its Demand Zone i.e. 29400-29500-29600 it can bounce back towards 30400 and Hence We Recommend to Go Short Below 29500-29400 and Go long only if GOLD sustains Above 30400.  

Sunday, 27 October 2013

GOLD AND SILVER COMEX Weekly Analysis (28-Oct-2013)

GOLD COMEX WEEKLY:
We Recommend to long GOLD COMEX above 1360$ for target of 1400$ with Stoploss of 1340$ Alternatively Go Short below 1325$ for Targets of 1300$ with Stoploss of 1345$
Trading Strategy: 
GOLD COMEX has stiff resistance @1355-1360$ levels. Markets Looks to be in Favor of Bulls and it Seems that Gold will breach its Immediate resistance Levels. Next Minor Resistance Level  that GOLD COMEX faces is @1370 and a Next Major Resistance is @1400$ which would also act as an psychological Level for GOLD. Alternatively if Unable to cross Resistance of 1355$ you may see Sell off below 1330$-1325$ and it can Head towards 1300$ mark.
------------------------------------------------------------------------------------------------------------
SILVER COMEX WEEKLY
We Recommend to initiate Long Position above 22.90$ for Target of 23.65$ and also buy at any Correction @22.10$. Stoploss should be maintained below 21.70$.
Trading Strategy: 
SILVER COMEX has formed classical double bottom pattern in a down trend and trading near to immediate Resistance Levels @22.85$ if SILVER COMEX crosses the levels of 22.85$ it may head towards higher levels @23.65$ Alternatively fresh long Position can also be initiated at lower levels around 22.10$.


Sunday, 22 September 2013

SILVER MCX & COMEX WEEKLY OUTLOOK

SILVER MCX & COMEX WEEKLY OUTLOOK (23-SEPT-2013)


SILVER COMEX:
Immediate Resistance @23.15$
Immediate Support @22.35$

Silver COMEX if Sustains above 23.35$ may head towards Higher Levels. For the next week Strategy should be to buy SILVER COMEX around 22.35$. Alternatively If Breaks 22.30 then may Initiate Short Position. Next Support Lies around 20.25$.

We Recommend to Sell SILVER COMEX Below 22.25$ SL 22.80$ TGT 20.25$

 SILVER MCX:
Immediate Support @48450
Immediate Resistance @51200

SILVER MCX if breaks the level of 48400 next  week one may initiate short Position. For pull Back Strategy one can Take Risk to long around 48500 with Small Stop Loss. Above 51200-51500 Silver May enter Bullish zone and Fresh Long Position Can be Initiated.

We Recommend to Sell SILVER MCX below 48300 SL 48800 TGT 47100

Tuesday, 2 April 2013

SILVER COMEX and SILVER MCX Trading Near to SUPPORT


SILVER MCX (2-April-2013) on daily charts seems to be trading near to Strong support zone 51300-51100, As SILVER today has a faced major Correction, Some Relief Rally is likely and Risk and Reward Ration on initiating a Long Position at current Levels will be favorable.

From Current Levels (51350) we recommend to Initiate a long position on SILVER MCX with stoploss as 50800 on Closing Basis.


SILVER COMEX is Also Trading Near to channel support around 27.20 - 27.25$ and there can be some relief rally in coming days for short term. Immediate Resistance is around 28.20$ and Risk Reward Ratio on while initiating a Long position is always high near to supports.

From Current Levels 27.22$ we Recommend to initiate a Fresh long position.
If Breaks 27$ on closing Basis then SILVER COMEX may head towards lower support levels around 26- 25.90 $

Wednesday, 27 March 2013

COPPER & LEAD COMEX FRESH BREAK DOWN

COPPER COMEX BREAKDOWN WEEKLY CHARTS


COPPER COMEX (27-March-2013) recently on weekly charts gave a breakdown of a classical symmetrical Triangle Pattern and Next Support is @3.20 $ Selling Opportunity Lies at current Levels. Major Profit Booking has been Seen in Commodities including Precious Metals and Base Metals.

Now Trading Near to levels around 3.4200 $. Here the Breakout on the weekly charts we suggest one can Initiate a Short Position on Copper MCX also following the Levels at COPPER COMEX. 


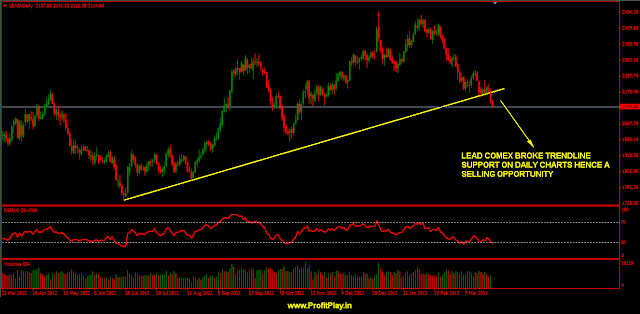
LEAD COMEX BREAKDOWN ON DAILY CHARTS


Fresh Breakout on The Charts of LEAD COMEX. Broke a Strong Trend line support Levels on Daily Charts. Next Support @1920 $ One Can Initiate a Short Position and Any bounce back towards higher level will be a selling opportunity.

Now Trading Near to Levels around 2115$ and further correction can can take LEAD COMEX around next Support @1920$. Based on the Breakdown on Daily charts Trend line support we suggest to Initiate Short Position at current levels and any any bounce back at higher levels will be a opportunity to take a short position. 

Thursday, 21 March 2013

SILVER MCX AND COMEX

HOURLY CHARTS OF SILVER MCX AND SILVER COMEX


SILVER MCX may face stiff resistance around 55300- 55400 levels. One can Initiate a short position around these levels.


SILVER COMEX may Face stiff Resistance around 29.50$- 29.45$ Levels. One can Initiate a short position around these levels.


Thursday, 14 March 2013

Silver COMEX

Hourly Chart Of Silver at COMEX


Silver COMEX can bounce Back from Current Levels Keep SL @28.50$ and Stay Long.

Reverse Position if Breaks 28.50$ levels and Sustain below these levels. Initiate Short Position if Silver Comex Trades Below 28.50$ Levels.