Monday 1 June 2020

GOLD MCX JUNE 2020 PREDICTION

GOLD MCX


GOLD MCX trading around resistance levels of 46950 and if GOLD MCX sustains above 46950 we may see upside in the GOLD MCX and It can again head towards levels of 48000- 50000 in the coming days.

If GOLD MCX do not sustains above levels of 46950- 47050 We may see Gold MCX again heading towards channel support levels of 45600-45500. 

Strategy to Play: So right now we are trading at make or break levels which should be played on the long side with small stoploss and once Stoploss is hit one can reverse the position to short.

GOLD COMEX

GOLD COMEX is trading in Rising Wedge Technical Pattern (Marked with Blue Lines in the chart Above) Support Zone for the GOLD COMEX is 1725- 1735$ Per Ounce.

One can Buy with Targets of 1772 $ and Stop loss Below 1710$.

You Can Use These Levels to Play GOLD MCX MINI (Take you Own Decision and Analyse you Risk Capacity Before Entering into position)

Tuesday 24 March 2020

Is Best Buying Levels to Invest in Indian Stock Markets are Around the Corners?

Is Best Buying Levels to Invest in Indian Stock Markets are Around the Corners?


Nifty Spot touched lows of 2252.75 in October 2008 Crash (U.S. Subprime Crises) And touched the highs of 12430.50 in Jan-2020 (Modi 2.0) - Seen rally of massive 10177.75 points

When we calculate 50% of this 10177.75 Points it come out to be 5088 Points And till today (24-March-2020) Nifty has corrected 4919.4 Points from highs of 12430.50 and Hits low of 7511.10. As per Fibonacci Series 61.8% Extreme Levels comes out to be 6140.65 (Click to read more about Fibonacci numbers : Fibonacci Retracement)

So, for investors its suggested to invest in Top 10 Nifty50 Blue-chip stocks as per the Nifty Spot Level. Invest in 3 Parts- First Part When Nifty Is near 7350- 7550 Levels (50% correction of 10177.75 Points). Second Part when we see further correction around 6150- 6350 Levels (61.8% correction of 10177.75 Points) and Third-Part Hold As cash in your portfolio as per the strategy for the risk management for the extreme levels when market enters depression.

As of now global markets are in fear and no one is suggesting buying so as per the rule of investing these are the best time for long term investments. It’s also said buy when everyone is bearish and Sell when everyone is bullish.

Invest in Top 10 Market Capitalization Companies of Indian Stock Markets:


Wednesday 18 March 2020

Crude Oil NYMEX ?? Is it Right time to buy Crude, Below is the Answer:

Sharp sell off has been across the globe and one of the beaten down consumable commodity is CRUDEOIL, As per the technical study and pattern, structure of NYMEX Crude is trading descending triangle. Currently trading near 25$ Per barrel and it can bottom out between 24$ to 22$.

Buying CRUDEOIL on MCX exchange when NYMEX trades between 24- 22$ provides comfort as far as risk and reward rations are concerned. 

Recommendation: One can go Long on Crude oil when NYMEX Prices trades between 22-24$ With Stoplosss 19.50$ and Targets of 35-40$ in the next few months.

#crudeoil #crude #commodity #trading #oil #mcx


Monday 7 October 2019

Which is the best momentum indicator for stock market trading?

Which is the best momentum indicator for stock market trading?

Here I am Gonna Revile you superb strategy to Trade using momentum Indicators in Stocks. Read it carefully and paper trade using strategy before actual trades.

There are many momentum Indicators used in Technical Analysis and you can not pin point any one to be performing or under performing. Before Using any momentum indicator you need to have a Strategy to Scan the market i.e you need to filter market using some parameters like:
  1. Open=High
  2. Open=Low
  3. Bullish Engulfing on Daily Chart.
  4. Bearish Engulfing on Daily Chart.
  5. News in Stocks.
  6. Volume Shockers Stocks
  7. Gap Up Or Gap Down Stocks.
Personally I look for Gap up and Gap Down in stocks due to news and then Place them in the trading terminal. Then comes the use of momentum indicators.

Once you find some breakout or breakdown on higher time frame (weekly and Daily charts) Due to the news then you try to trade those stocks using momentum indicators like: Awesome oscillator , RSI, MACD, ADX, Exponential Moving Averages Etc.

Today: ZEEL and HDFCBANK was in news How you can have traded both Stocks using momentum indicators Awesome Oscillator and RSI


Example 1: HDFCBANK


In the the above HDFCBANK 5 mins Chart (07-Oct-2019) you can See that Stock broke the Support levels- Marked with Red Horizontal Line with All Momentum Indicator supporting the Stock i.e. AO was Trading below Zero, RSI was Crossing 40 Levels. So you can confidently take a trade in the script.

Example 2: ZEEL


In the the Above ZEEL 5 mins Chart (07-Oct-2019) you can See that Stock broke the Resistance levels of Rising Wedge Pattern- Marked with Red Lines with All Momentum Indicator supporting the Stock i.e. AO was Trading below Zero, RSI was Crossing 40 Levels. So you can confidently take a trade in the script.

If you like the strategy and want to follow our live trades you can follow us on Telegram Channel ProfitPlay. Get Free Calls in Future Segment

Sunday 6 October 2019

At the current price levels, is INDUSINDBK a good buy for the long term? Why or why not?

At the current price levels, is INDUSINDBK a good buy for the long term? Why or why not?

Market Outlook:
Markets seems be over valued at this point of time, Upside in the market is very limited and from here we can see correction in overall market and Bank nifty. Nifty since it made low in 2008 without any major correction at made Highs around 12k mark. There are business and market cycles and hence I personally suggest you to sit on cash and start picking good Mid Cap stocks rather the investing in front line. Indian Banking System seems to be suffering huge from Defaults and NPA'S.
TECHNICAL OUTLOOK:
IndusindBank has seen huge rally since Year 2010, Stock has seen No Major correction till Date in the Last 9 years, As there is pressure on Indian Banking Index, So we can see Fresh short coming below 1150 Levels. In the Chart Attached below We have shown, Stock has broken 240 Weeks Trend line Support and Trading near to Support zone, If stock does not hold support levels of 1150- 1180 then we may see Stock crashing from here.

Join Us on Telegram: ProfitPlay
Get Free Calls in Future Segment Where there is no Advertisement, No Promotion on our channel. Lets Learn and Earn together.

How do I enhance the accuracy of RSI while trading intraday?

How do I enhance the accuracy of RSI while trading intraday?


No indicator can enhance your accuracy for Trade.
Default setting for RSI is 80–20 i.e. Above 80 RSI is said to be overbought & below 20 mark RSI is said to be oversold.
But when you apply RSI to Nifty or Stock Chart you may see that there are many occasion where you get trapped, when RSI is above 80 Nifty Gets more momentum and head towards higher levels.
So I suggest you to Use following Setup to enhance your accuracy in Intraday:
Step 1: Change to RSI default settings to 60–40 (Buy Above 60 Levels and Sell below 40 Levels)
Step 2: Place Parabolic Sar (PSAR) to Chart.
Step 3: Place MACD Histrogram
Step 4: Chance Intraday Time to 15 Min
For BUY SIGNAL: RSI Should should be crossing 60 above Levels and Parabolic Sar (PSAR) Should be Green or below Current Price and MACD Histogram Should be Above zero line. If 3 Condition Fulfills then Buy.
For SELL SIGNAL: RSI Should should be crossing Below 40 above Levels and Parabolic Sar (PSAR) Should be Red or Above Current Price and MACD Histogram Should be below zero line. If 3 Condition Fulfills then Sell.
Join Us on Telegram: ProfitPlay
Get Free Future Segment Calls with proper hedge, Lets maximize our profits together. No Marketing no Ads on our Channel, Just True Research and Learning.

Wednesday 2 October 2019

How Can I Master Trading in Stocks and Commodities?

How Can I Master Trading in Stocks and Commodities?

Mastering Technical Analysis is not too easy and not too tough. You need to Train your eyes and master any one patter you love to trade. There are many techniques and methods to trade but I would suggest you to trade manually not via algo. Learn the basis of Technical Analysis and then follow the steps mentioed below:

First Step: Stock Scannig
You need to have a scanner to scan the market i.e. which stocks you want to trade Top Gainer and looser, Volume shockers, Intraday Recovery Stocks, Open Interest Gainer Looser etc.

Second Step: Time Frame and Charting Tool
You need to choose time frame on which you what to trade i.e. Hourly Chart, 15 Min Chart, 5 min Chart or 1 min Chart. This depends on your trading style. I personally Trade on multiple time frame i.e. looking at multiple time frame in one go or one screen. For this you need best charting tools and I would suggest you to use Sharekhan's Trade Tiger or Fyers securities i-dart both are desktop application with many in built scanner which are very helpful for beginners.

Third Step: Money Management, Position Sizing, Trade Management and Accuracy:
You need to master money management i.e. always have a stop-loss while trading and need to have a good risk to reward ratio. Then comes position Sizing where you need to decide how much quantity or lots to trade depending on your PROFIT AND LOSS or you risk capacity. Then comes Trade Management where you can have fixed targets or you may have Trailing stop-loss technique. Always start with half quantity and add quantity when you are winning the trade and keep trailing the Stop loss till your desired profit is reached. Then comes accuracy, be accurate in picking the right stock and right moves this will increase you chance to gaining and earning from Trading.

Wednesday 7 August 2019

GOLD COMEX VIEW AUGUST 2019

GOLD COMEX seems to be heading towards 1600$ per ounce in the near term, Now Equity as an asset class seems to be under performing and Gold after a huge consolidation is best asset class to invest in.  


Tuesday 23 July 2019

CANARA BANK BREAKDOWN VIEWS

#CANARABANK #BREAKDOWN #TECHNICALS #PSUBANK #HEDGE

Fresh breakdown seen in CANARA BANK, Stock today (23-July-2019) broke trend line support levels. On the downside Support seen at 240 levels now.

Short position can be initiated in CANBK Future @ 260 Levels with Buying CANBK 260 JULY Call Option @ 5.10

(MAX RISK: RS. 10000 Per Lot) 


This is Just For Educational Purpose, Always consult to expect before initiation any position.

NSE PUSBANK INDEX - BREAKDOWN & SHORT TERM VIEW


Fresh breakdown has been seen in NSE PSUBANK INDEX, SBI leading with fresh breakdown below 346, If sustains below 346 Stock may witness further correction.


Sunday 23 July 2017

Coal India Short Term Target Price @ 290


Coal India has seen a Turn around from the Bottoms and we see stock heading towards higher Levels. In the Last Trading session Stock has seen Short covering and delivery Volumes and Trading Volumes had surged with significant increase in price, We See Stock to Head towards 290 Levels from 250-260 levels, We Recommend to Buy Stock With stoploss of 245 for target Price of 290 

Saturday 17 June 2017

Nifty Future Trading Sideways in the June 2017 Series

Nifty Future Trading Sideways in the June 2017 Series, India VXI Volatility Index is towards Lows, We Suggest to Wait  for Clear Signals of Trend, If Nifty Hold Levels @ 9500- 9530 The Up Trend May Resume, Any Break down below 9500 can drag nifty towards lower levels @  9300


Friday 2 September 2016

Book Profits in REL CAP @ 530 (23% RETURNS)


We Recommended to Buy Reliance Capital @ 430 on 8-July-2016 (See to the Last Post). Book Profits @ 530 Levels As Target Already Achieved. Markets Look Over strached and Profit booking is Expected now. Over All Markets seems to be Healthy, But Correction is pending Hence Expecting Nifty to Correct. 


Thursday 28 July 2016

Reliance Capital Time to Buy Stock upside 20-25%

Reliance Capital Looks Strong on Charts Time to Buy


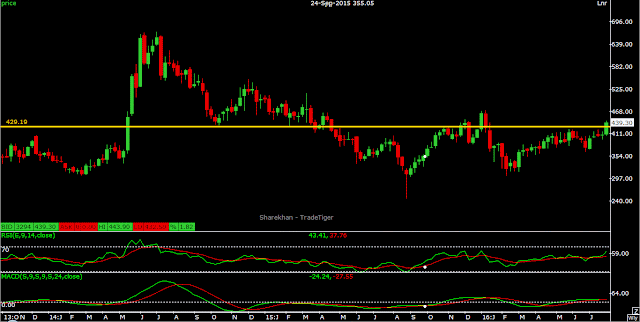
Reliance Capital Looks Strong on Weekly chart. Stock has managed to close above Resistance levels @ 425- 430, We Expect  More Upside in Coming Days, Hence we Recommend buy on Reliance Capital for Target 500 and Stoploss 400

Wednesday 23 March 2016

Monday 21 March 2016

Pair Trade- Neutral Strategy (21-March-2016)


We initiated 3 Trades According to Correlation, Z-Score and Pair Spreads Method For More Details Contact 8889465053


Monday 15 February 2016

GOLD INTRADAY AND SHORT TERM VIEW (15-Feb-2016)

GOLD INTRADAY BUY OPPORTUNITY (15-FEB-2016)

Below is the Chart of GOLD COMEX, Strong Trend Line Support Lies at 1214$, Today Indian Markets has Opened with Gap Down, And Hence Likely to cover the Gap, Hence we Recommend to Buy GOLD With an Stoploss of 1214$ for the Intraday.