

Sunday 29 December 2013
Wednesday 11 December 2013
NATURAL GAS OUTLOOK (11-DEC-2013)
Fundamentals of Natural Gas NYMEX:
With the traditional pre-winter rally in natural gas underway, bullish predictions of much higher prices are starting to emerge. But is the natural gas market - which has been burdened with oversupply for quite some time - finally ready to break out?
The latest supply and demand data from the Energy Information Administration may offer some clues. On the supply side, little has changed. Output continues to boom and there are no signs of an imminent decline in production, as many analysts have predicted time and time again.
In July, gross natural gas production in the U.S. jumped to 74.52 bcf/d, a record high. That was up 1.8 bcf/d, or 2.5 percent, from a year ago.
Technicals of Natural Gas NYMEX:
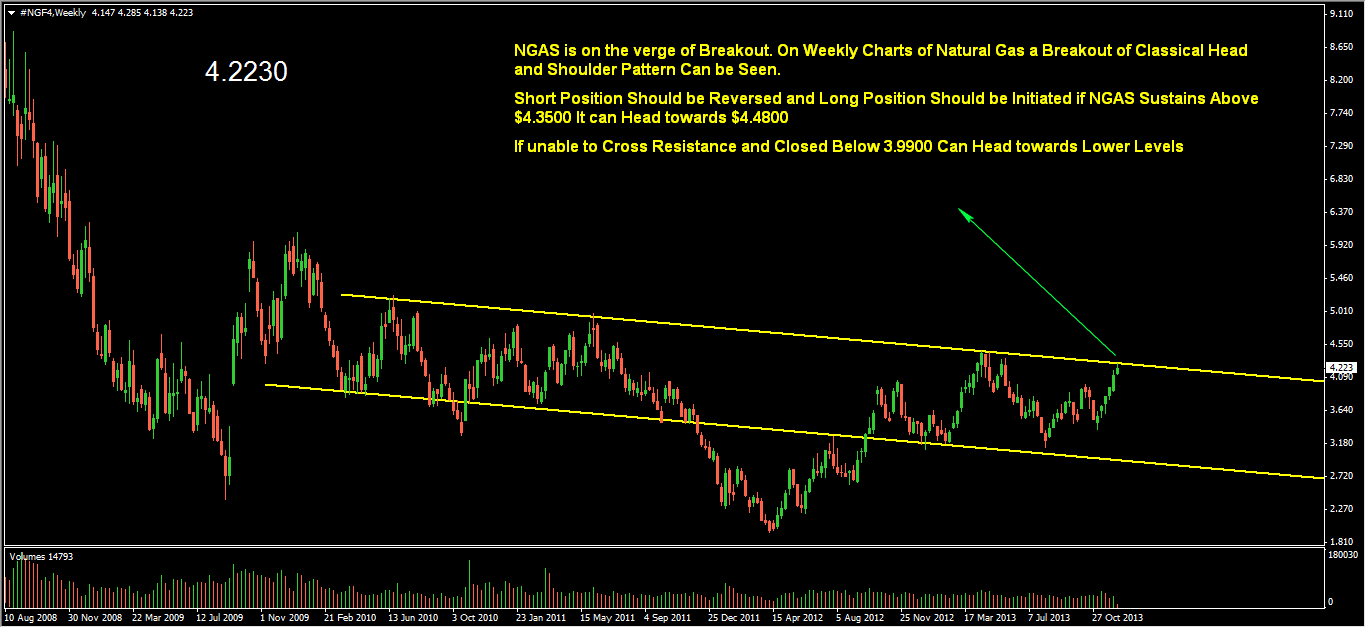
NATURAL GAS is on the verge of Breakout. On Weekly Charts of Natural Gas a Breakout level of Classical Head and Shoulder Pattern Can be Seen. Short Position Should be Reversed and Long Position Should be Initiated "if" NGAS Sustains Above $4.3500 It can Head towards $4.4800
Unable to Cross Immediate Resistance @4.3200 and Closed Below 3.9900 Can Head towards Lower Levels as Fundamentals Also Suggests.
With the traditional pre-winter rally in natural gas underway, bullish predictions of much higher prices are starting to emerge. But is the natural gas market - which has been burdened with oversupply for quite some time - finally ready to break out?
The latest supply and demand data from the Energy Information Administration may offer some clues. On the supply side, little has changed. Output continues to boom and there are no signs of an imminent decline in production, as many analysts have predicted time and time again.
In July, gross natural gas production in the U.S. jumped to 74.52 bcf/d, a record high. That was up 1.8 bcf/d, or 2.5 percent, from a year ago.
Technicals of Natural Gas NYMEX:
NATURAL GAS is on the verge of Breakout. On Weekly Charts of Natural Gas a Breakout level of Classical Head and Shoulder Pattern Can be Seen. Short Position Should be Reversed and Long Position Should be Initiated "if" NGAS Sustains Above $4.3500 It can Head towards $4.4800
Unable to Cross Immediate Resistance @4.3200 and Closed Below 3.9900 Can Head towards Lower Levels as Fundamentals Also Suggests.
Thursday 14 November 2013
MCX CRUDEOIL Strategy For Investors And Swing Players....!!!!
MCX CRUDEOIL Strategy For Investors And Swing Players
MCX CRUDEOIL is Trading Near to Support Levels @5850-5950. And A Fresh Long position Can be Initiated by Commodity Investors and Swing players. Immediate Resistance on Charts is @6175 and Hence Buy Crudeoil @5950 and 5850 with Stoploss of 5780 For Targets of 6175 and More.
1. WTI- CRUDEOIL is Consolidating Between Classical Channel Pattern And Trading Near to the Support of Channel @92-94 $.
2. We Recommend investors and Swing Player to buy Crudeoil. As at Support Levels Risk and Reward Ratio is Favourable.
3. If it Breaks Channel Support and Trades below 91$ Reverse your Long Positions and initiate Fresh Position.

Sunday 10 November 2013
GOLD WEEKLY TRADING STRATEGY
 |
| GOLD MCX FOUR HOURLY CHART 11-Nov-2013 |
 |
| GOLD COMEX FOUR HOURLY CHART 11-NOV-2013 |
WEEKLY TRADING STRATEGY:
GOLD MCX faced correction last week and due to US strong
Employment Data Precious Metals in COMEX face a sell off and GOLD COMEX broke
important Support @1300-1295$ and Close below it. Hence this week we may see down trend
continuing. GOLD MCX is also trading
near to strong Support Levels @29550 and If Sustains below it can head towards
lower levels @29000. Alternatively if sustains above its Demand Zone i.e.
29400-29500-29600 it can bounce back towards 30400 and Hence We Recommend to Go
Short Below 29500-29400 and Go long only if GOLD sustains Above 30400.
